Algebra House
  • Ask a Question
    • Answered Questions
  • Examples
  • State Test Practice
    • Algebra 1 State Test Practice
    • Geometry State Test Practice
  • ACT and SAT
  • Calculators
    • Problem Solver
    • Graphing Calculator
    • 3D Graphing Calculator
  • Contact
    • Contact Algebra House
    • Leave a Tip


​​ACT & SAT practice

How to Graph a System of Inequalities

1/21/2019

 
Which of the following inequalities is represented by the shaded region of the graph below ?
Picture
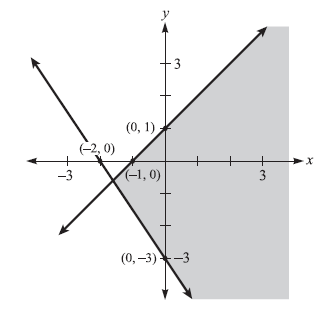
A.)  y ≤ x + 1  or  y ≥ x - 3
B.)  y ≥ x + 1  or  y ≤ x - 3
C.)  y ≤ x + 1  or  y ≥ (-3/2)x + 3
D,)  y ≤ x + 1  or  y ≤ (-3/2)x - 3
E.)  y ≤ x + 1  or  y ≥ (-3/2)x - 3

When graphing inequalities:
  • ≤  and  ≥ signs indicate a solid boundary line, while <  and  >  signs indicate a dashed boundary line
  • shading below the line indicates use of < or ≤ signs
  • shading above the line indicates > or ≥ signs

First, locate the y-intercept of each line, while also determining the slope of each line.

One line
y-intercept is 1
slope is 1
Equation is y = x + 1
Also, the shading is below that line, and it is a solid line,
Therefore, the inequality is:
y ≤ x + 1 
 {boundary line is y = x + 1, using ≤ sign because of solid line, using ≤ sign because of shading below}

Other line
y-intercept is -3
slope is -3/2
Equation of boundary line is y = (-3/2)x - 3
Also, the shading is above that line, and it is a solid line.
Therefore, the inequality is:
​y ≥ (-3/2)x - 3 
 {boundary line is y = (-3/2)x - 3, using ≥ sign because of solid line, using ≥ sign because of shading above}

Put the two together, and you have:
E.)  y ≤ x + 1  or  y ≥ (-3/2)x - 3

Ask Algebra House
​

Comments are closed.

    Ask a Question
    Latest Videos
    Picture


    Archives

    December 2023
    May 2022
    March 2022
    February 2022
    January 2022
    December 2021
    November 2021
    September 2021
    August 2021
    July 2021
    June 2021
    May 2021
    April 2021
    March 2021
    July 2020
    October 2019
    March 2019
    February 2019
    January 2019
    December 2018
    February 2018
    January 2018
    December 2017
    November 2017
    March 2017
    February 2017
    December 2016
    November 2016
    October 2016
    July 2016
    February 2016
    January 2016
    December 2015
    November 2015
    October 2015
    September 2015
    August 2015
    June 2015
    May 2015
    April 2015
    March 2015
    February 2015
    January 2015
    December 2014
    November 2014
    September 2014
    March 2014
    February 2014
    January 2014
    December 2013
    October 2013
    September 2013
    August 2013
    May 2013
    March 2013
    February 2013
    January 2013
    April 2012
    March 2012
    February 2012
    January 2012
    December 2011
    November 2011

    ACT is a registered trademark of ACT, Inc. SAT is a registered trademark of the College Board. ACT and SAT are not affiliated with this site.
In case you missed it:
Go Home
​​Ask a Question
Answered Questions
Algebra Examples
State Test Practice

ACT and SAT Practice
​
Notes Archive​
Leave a Tip
​​Problem Solver
Graphing Calculator
3D Graphing Calculator
​Privacy Policy
​
Cookie Policy
  • Ask a Question
    • Answered Questions
  • Examples
  • State Test Practice
    • Algebra 1 State Test Practice
    • Geometry State Test Practice
  • ACT and SAT
  • Calculators
    • Problem Solver
    • Graphing Calculator
    • 3D Graphing Calculator
  • Contact
    • Contact Algebra House
    • Leave a Tip