|
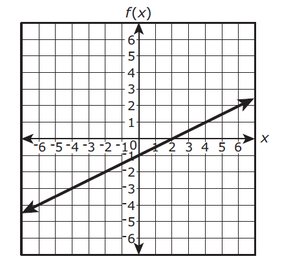
The graph of the function f(x) = -1 + 0.5x is shown on the coordinate plane.
For what value of x does f(x) = 0?
Where f(x) = 0 is the x-intercept. That is where the graph crosses the x-axis. Remember, f(x) is the
y-value, so if y is equal to 0, this is the x-intercept. The graph of f is the graph of the equation y = f(x). The value of x, when f(x) = 0 is 2. Ask Algebra House Comments are closed.
|
Latest Videos
Algebra 1 State Test Practice Archives
November 2023
|


