|
The manager of a company uses the function shown to model its profit based on the price of a product in dollars, x.
f(x) = (x - 2)(53 - x)
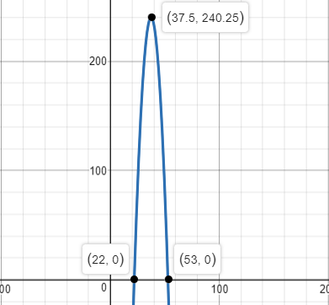
If you use the graphing calculator, you will see:
The graph of this quadratic function would be a parabola, with: - the x-axis representing the price of the product - the y-axis representing the total profit
A.) $22 is the minimum price to avoid a loss {an x-intercept where the profit is $0}
B.) $53 is the maximum price to avoid a loss {an x-intercept where the profit is $0} C.) $37.50 is the price that results in the greatest profit {the maximum/vertex of the parabola} Ask Algebra House Comments are closed.
|
Latest Videos
Algebra 1 State Test Practice Archives
November 2023
|


