
|
A tennis ball was 2 feet off the ground when a tennis player hit it so that the ball traveled up in the air before coming back to the ground. The height of the tennis ball is described by the graph shown. Numbers along the x-axis represent the time, in seconds, after the ball was hit, and the numbers along the y-axis represent the height, in feet, of the ball at time x.
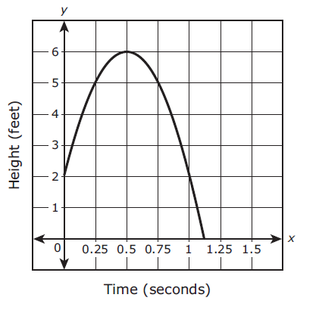
Use the graph to represent the average rate of change of the height of the ball for the first 0.25 second after being hit.
A.) 0.75 feet per second B.) 3.0 feet per second C.) 12 feet per second D.) 20 feet per second
Video Answer and Explanation:
0 Comments
Your comment will be posted after it is approved.
Leave a Reply. |

Latest Videos

Algebra 1 State Test Practice Archives
November 2023
|