|
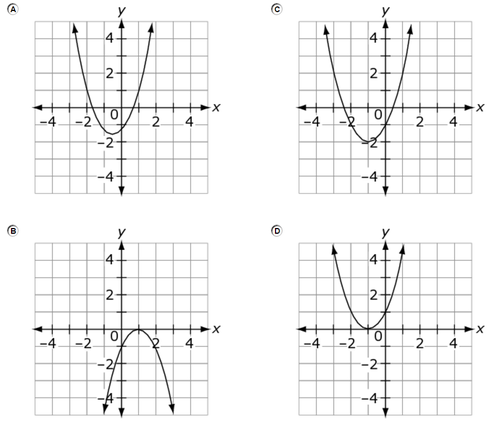
A function is shown.
f(x) = x² + 2x - 1 Which graph represents this function?
In the function f(x) = x² + 2x - 1,
- the constant term, -1, is the y-intercept of the graph - the x² term is positive, meaning the parabola opens upward - also, the x-coordinate of the vertex is -b -2 ---- = ----- = -1 is the x-coordinate of the vertex 2a 2(1) y-intercept is -1 parabola opens up x-coordinate of vertex is -1 Graph C.) {the one on the top right} Ask Algebra House Comments are closed.
|
Latest Videos
Algebra 1 State Test Practice Archives
November 2023
|


